

Asset Class Recap
During April, May and June, stock and bond prices were punished for a second consecutive quarter. Each of the asset classes we commonly include in our portfolios in the table below (with the exception of cash) had a negative total return for the first and second quarters of the year. We pulled quarterly return history for the last 40 years and found only two other quarters where all these asset classes were simultaneously negative; Q2 1984, in a sharply rising interest rate environment, and Q1 1990, when markets became worried about an Iraqi invasion of Kuwait.

Economists define a “bear market” as a market decline of at least 20% while a “correction” is a 10% pullback. All the asset classes in the table above have seen a year-to-date correction while some have crossed into bear market territory. Multiple factors have come together to bring the S&P 500 index sharply back down since it reached its all-time high on 1/3/2022, but rising interest rates have been the most significant factor.
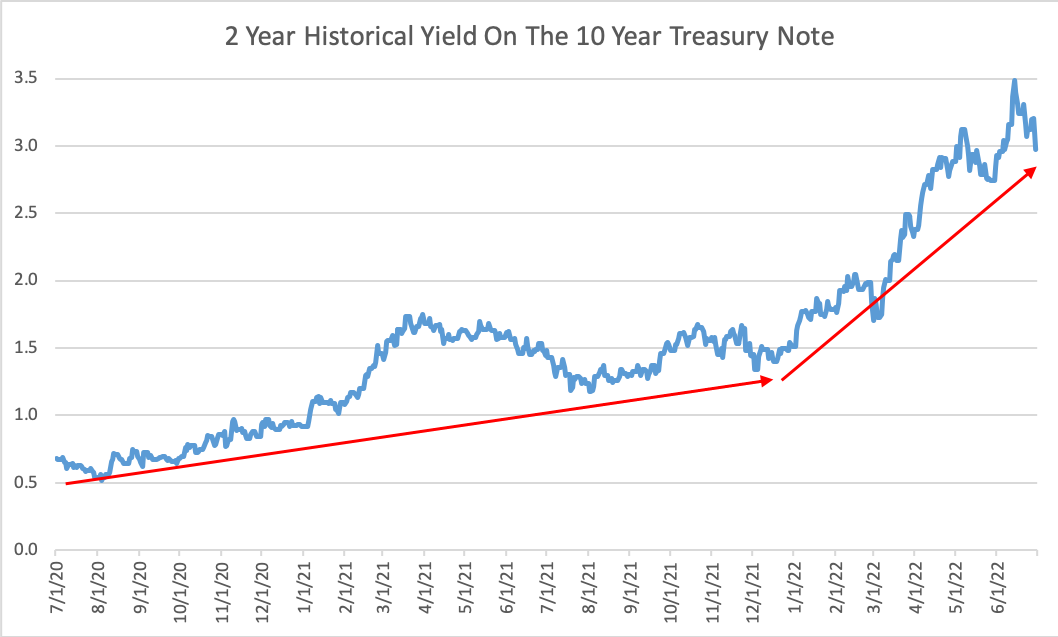
Warren Buffett has said, “The most important item over time in valuation is obviously interest rates” and, “The bogey is always what government bonds yield.” This observation helps us understand a significant portion of the market’s 2022 pullback. Interest rates have increased more sharply than expected this year for multiple reasons. The Federal Reserve’s Quantitative Easing program that kicked off in November 2008 has intentionally kept interest rates artificially low for far longer than most economists expected and is finally starting to end. High inflation caused by; continuing COVID related shortages, energy supply constraints due to sanctions on Russia, commodity shortages from Ukraine, and federal limitations on “dirty” energy production, has prompted the Fed to take swift inflation fighting action.
To quantify the link between interest rates and stock valuations, we can lean on the Capital Asset Pricing Model’s concept that riskier investments deserve to earn higher returns to compensate you for accepting volatility. Over the last 25 years, the earnings yield for the S&P 500 index has exceeded the 10 year treasury note yield by an average of 1.89% each year. If we take the reciprocal of earnings yield, we have the commonly reported and analyzed valuation metric of Price-to-Earnings (P/E ratio). When we build a graph that plots the relationship between 10 year treasury note yields and expected stock P/E’s with the 1.89% equity premium baked in, we see the relationship below.
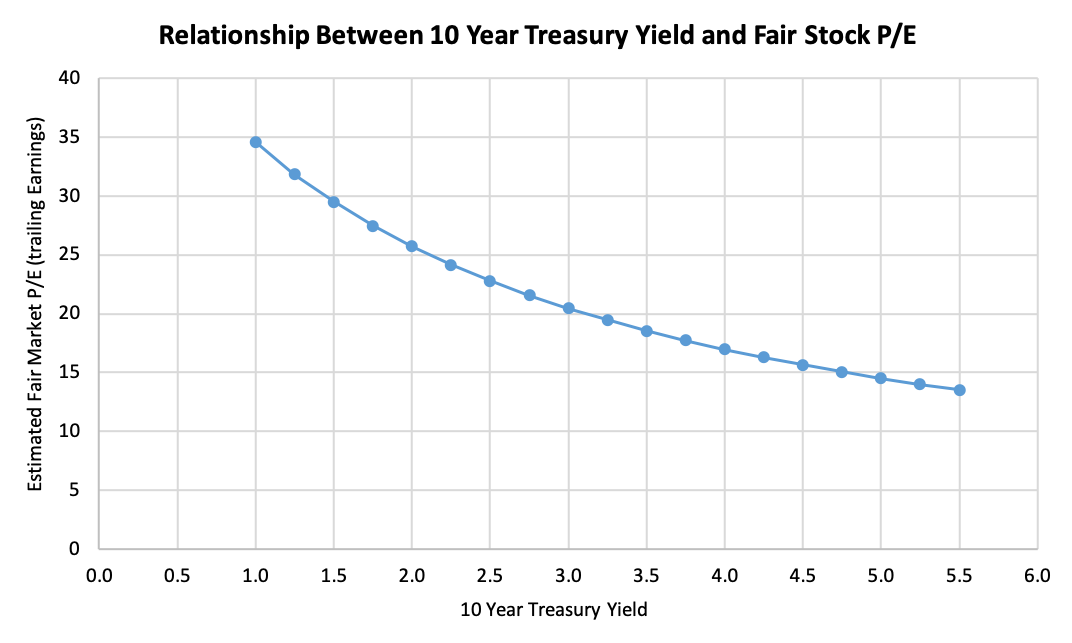
As rates rise, we should expect prevailing P/E’s to drop and stock prices should drop. This makes intuitive sense, because rising interest rates make bonds more attractive. Investors are enticed to pull some money out of stocks to invest in bonds, creating stock selling that puts downward pressure on stock prices. The yield on the 10 year treasury bond started the year at 1.51% and has nearly doubled to 2.97% at 6/30/22. The chart above suggests that fair P/E’s might move from 30 toward 20 with this type of change in treasury yields. Because there are many other factors that affect stock valuations in addition to treasury yields, we have not seen a move quite this strong, but this move in P/E’s is not too far off from what we have actually seen.
The blue numbers in the table below suggest a wide range of potentially fair values for the S&P 500 index, given various combinations of interest rates and weighted average corporate earnings, which were $198 for each unit of the S&P 500 index over the last year. The black circle shows where we are at today, with a 10 year treasury yield of 3% and earnings of about $200 and suggests a fair value for the S&P 500 of $4,090, which is a bit higher than where we are today. The black arrow shows the general direction of where we have come from over the last year – yields have increased while earnings have increased and the S&P 500 value has dropped sharply. The red arrow shows the general direction I expect we are headed – moderately higher interest rates, higher earnings and a slightly higher S&P 500 value. The four highlighted corner portfolios show outlier stock market values that are possible if we get extreme moves in earnings (due to a recession?) or interest rates (an additional surprise shock that pushes inflation higher?), but I believe any of these corner values are unlikely to happen within the next year.

The table below has returns for 23 non-traditional and alternative investments that we track. Although every one of the investments in the table has a 10 year return that is lower than the S&P 500 index, alternatives provide an attractive way to diversify a portfolio in various market environments. In high inflationary environments, Commodities traditionally perform well, which we see at the bottom of the table, as Invesco Optimum Yield Diversified Commodity Strategy ETF (ticker: PDBC) has returned 28.5% YTD and iPath® Pure Beta Crude Oil ETN (ticker: OIL) has returned 46.4% YTD. The average of the year-to-date returns in the table below is -9.0%, which is a terrible return, but is much higher than year-to-date returns for traditional stocks and bonds (in the first table of this writeup).

Disclosures
Opinions expressed are as of the current date; such opinions are subject to change without notice. Advyzon Investment Management shall not be responsible for any trading decisions, damages, or other losses resulting from, or related to, the information, data, analyses or opinions or their use. This commentary is for informational purposes only. The information, data, analyses, and opinions presented herein do not constitute investment advice, are provided solely for informational purposes and therefore are not an offer to buy or sell a security. Please note that references to specific securities or other investment options within this piece should not be considered an offer (as defined by the Securities and Exchange Act) to purchase or sell that specific investment or a recommendation for a particular product.
Performance data shown represents past performance. Past performance does not guarantee future results. All investments involve risk, including the loss of principal. There can be no assurance that any financial strategy will be successful. This commentary contains certain forward-looking statements. We may use words such as “expects”, “anticipates”, “believes”, “estimates”, “forecasts”, and similar expressions to identify forward-looking statements. Such forward-looking statements involve known and unknown risks, uncertainties and other factors which may cause the actual results to differ materially and/or substantially from any future results, performance or achievements expressed or implied by those projected in the forward-looking statements for any reason.
Investment management and financial advice offered by Advyzon Investment Management is intended for citizens or legal residents of the United States or its territories. Investing in securities involves risks, including but are not limited to; currency risk, political risk, geographic risk, concentration risk, custody risk, asset class risk, management risk, market risk, operational risk, passive investment risk, securities lending risk, tracking error risk, tax risk, valuation risk, and infectious illness risk. Investing in emerging markets may increase these risks. Emerging markets are countries with relatively young stock and bond markets. Typically, emerging-markets investments have the potential for losses and gains larger than those of developed-market investments. A debt security refers to money borrowed that must be repaid that has a fixed amount, a maturity date(s), and usually a specific rate of interest. Some debt securities are discounted in the original purchase price. Examples of debt securities are treasury bills, bonds and commercial paper. The borrower pays interest for the use of the money and pays the principal amount on a specified date. High yield debt (non-investment grade or junk bonds) can be more risky than higher rated debt, typically has a higher default rate than investment grade and treasury debt, and high yield funds can lose principal.
“SBBI” stands for “Stocks, Bonds. Bills, and Inflation”. “Stocks, Bonds, Bills, and Inflation”, “SBBI”, and “Ibbotson” (when used in conjunction with a series or publication name) are registered trademarks of Morningstar, Inc. ©2021 Morningstar.
“CRSP” stands for Center for Research in Security Prices. Part of the University of Chicago’s Booth School of Business, the CRSP is a nonprofit organization that is used by academic, commercial, and government agencies to access information such as price, dividends, and rates of returns on stocks.
The indexes noted are unmanaged and cannot be directly invested in. Individual index performance is provided as a reference only. Since indexes and/or composition levels may change over time, actual return and risk characteristics may be higher or lower than those presented. Although index performance data is gathered from reliable sources, Advyzon Investment Management cannot guarantee its accuracy, completeness or reliability.
Cryptocurrencies, including Bitcoin, are currently unregulated, illiquid, uninsured, carry technological risks, require unique tax treatment, and are volatile.