

Asset class recap for April
April was a bad month for most asset classes in our table below. During April, U.S. stocks gave back a large part of the Year-to-Date returns they had accumulated between January 1 and March 31. Emerging Markets Stocks were a bright spot with a positive return, demonstrating their value as a diversifier.

Interest rates were the most impactful factor that put a drag on returns in April, as the yield on the 10-year Treasury note climbed from 4.21% on March 31 to 4.67% on April 30. Investors are still coming to terms with the idea that the U.S. Federal Reserve is very unlikely to lower rates significantly in 2024. The yield curve is slowly “baking in” that expectation, with interest-rate-sensitive assets dropping in price.
The chart below shows the daily price for the S&P 500 Index during April (in blue, axis on left) and the yield on the 10 Year Treasury Note (in orange, axis on right). It is clear to see the continuing strong negative correlation between the two. This overbearing linkage is likely to continue and cause further broad market volatility until more consensus is shared about the “right” level of long-term interest rates for U.S. markets.

Emerging Markets stocks had a positive month in April, outperforming other broad equity asset classes we track. China and India receive the largest allocations in many Emerging Markets stock indexes. iShares.com reports that the iShares MSCI China ETF returned 5.4% in April, while the iShares MSCI India ETF returned 1.3%. These countries saw stock prices jump for a mix of macroeconomic and local regulatory reasons. With average price-to-earnings (P/E) ratios for Emerging Markets equities below 14, and the average P/E ratio for the S&P 500 index above 24 last month, it didn’t take much good news for Emerging Markets stocks to see a relative price pop.
Among U.S. Equity Sectors, Utilities performed best in April, with the S&P 500 Sector Utilities Index returning 1.6%, which was 5.7% ahead of the S&P 500 Index’s -4.1%. This outperformance was primarily the result of two things.
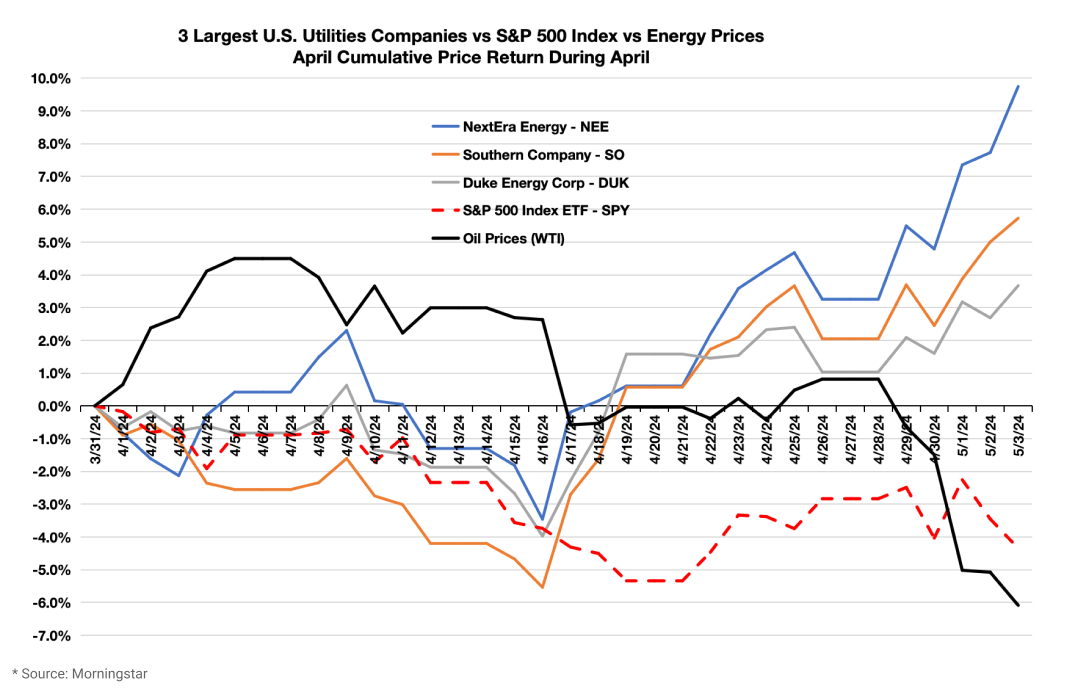
- Energy prices dropped during April. In particular, on April 16, a couple days after Iran launched aerial strikes on Israel, Israel’s response was restrained. Oil prices dropped, and prices for the largest utilities jumped.
- Some investors have come to expect that high demand for electricity from growing data centers and energy hungry artificial intelligence processing may create a meaningful amount of new demand for energy and lead to new profits for utilities. This was another market segment that was poised for a rebound, as the Utilities sector has the second lowest 5 year return among all 11 S&P 500 sectors (only Real Estate has produced lower returns).
The chart below shows cumulative returns during April for the three largest Utility stock holdings in State Street’s Utilities Select Sector SPDR ETF Fund (ticker: XLU); NextEra Energy Inc, Southern Co, and Duke Energy Corp. The chart also includes State Street’s SPDR S&P 500 ETF Trust (ticker: SPY) and WTI Oil for comparison. On April 16, prices for Utilities stocks started a multi-week run while oil prices started dropping.
Disclosures
Opinions expressed are as of the current date; such opinions are subject to change without notice. Advyzon Investment Management shall not be responsible for any trading decisions, damages, or other losses resulting from, or related to, the information, data, analyses or opinions or their use. This commentary is for informational purposes only. The information, data, analyses, and opinions presented herein do not constitute investment advice, are provided solely for informational purposes and therefore are not an offer to buy or sell a security. Please note that references to specific securities or other investment options within this piece should not be considered an offer (as defined by the Securities and Exchange Act) to purchase or sell that specific investment or a recommendation for a particular product.
Performance data shown represents past performance. Past performance does not guarantee future results. All investments involve risk, including the loss of principal. There can be no assurance that any financial strategy will be successful. This commentary contains certain forward-looking statements. We may use words such as “expects”, “anticipates”, “believes”, “estimates”, “forecasts”, and similar expressions to identify forward-looking statements. Such forward-looking statements involve known and unknown risks, uncertainties and other factors which may cause the actual results to differ materially and/or substantially from any future results, performance or achievements expressed or implied by those projected in the forward-looking statements for any reason.
Investment management and financial advice offered by Advyzon Investment Management is intended for citizens or legal residents of the United States or its territories. Investing in securities involves risks, including but are not limited to; currency risk, political risk, geographic risk, concentration risk, custody risk, asset class risk, management risk, market risk, operational risk, passive investment risk, securities lending risk, tracking error risk, tax risk, valuation risk, and infectious illness risk. Investing in emerging markets may increase these risks. Emerging markets are countries with relatively young stock and bond markets. Typically, emerging-markets investments have the potential for losses and gains larger than those of developed-market investments. A debt security refers to money borrowed that must be repaid that has a fixed amount, a maturity date(s), and usually a specific rate of interest. Some debt securities are discounted in the original purchase price. Examples of debt securities are treasury bills, bonds and commercial paper. The borrower pays interest for the use of the money and pays the principal amount on a specified date. High yield debt (non-investment grade or junk bonds) can be more risky than higher rated debt, typically has a higher default rate than investment grade and treasury debt, and high yield funds can lose principal.
“SBBI” stands for “Stocks, Bonds. Bills, and Inflation”. “Stocks, Bonds, Bills, and Inflation”, “SBBI”, and “Ibbotson” (when used in conjunction with a series or publication name) are registered trademarks of Morningstar, Inc. ©2021 Morningstar.“CRSP” stands for Center for Research in Security Prices. Part of the University of Chicago’s Booth School of Business, the CRSP is a nonprofit organization that is used by academic, commercial, and government agencies to access information such as price, dividends, and rates of returns on stocks.
The indexes noted are unmanaged and cannot be directly invested in. Individual index performance is provided as a reference only. Since indexes and/or composition levels may change over time, actual return and risk characteristics may be higher or lower than those presented. Although index performance data is gathered from reliable sources, Advyzon Investment Management cannot guarantee its accuracy, completeness or reliability.