

Asset Class Recap for the Quarter
March was a good month for all of the asset classes we track below, as each of them had positive returns. The quarter was very good for stocks, but negative for long term and intermediate term bonds. The three market trends that impacted security returns most significantly for Q1 were
- Intermediate and long term interest rates increased
- The artificial intelligence bubble continued to expand
- Oil prices increased
The S&P 500 returned 10.6% during the first quarter, which is roughly the historical average return for a full calendar year. Growth stocks outperformed value stocks, as higher oil prices helped push energy related stock prices up, while A.I. stock momentum propelled growth stocks even higher. U.S. stocks outperformed international stocks, with a strengthening U.S. Dollar providing a majority of the relative outperformance.
Bond yields for all but the very shortest duration bonds rose during Q1, which drove bond prices lower. High yield and short term bonds overcame price headwinds, thanks to the higher coupon payments for risky high yield bonds and the lower interest rate sensitivity of short term bonds.

Investors, advisors, portfolio managers and the Fed all continue to grapple with uncertainty about where interest rates and inflation might be in the next 3 months, 1 year, 3 years, and beyond. Interest rates are a major factor in the prices of all investment securities, and in my 30 years of working with investments, I cannot remember a time when markets were so uncertain about what the yield curve might look like a year from today.
At the start of the year, the average economist was forecasting that the Fed would cut overnight interest rates 6 times during 2024, from the current 5.375% midpoint to 3.875%. Those expectations have been drastically reduced, as many economists are now forecasting only 3 cuts. Interest rates in the intermediate and longer ends of the yield curve are highly correlated to expectations for the Fed’s overnight interest rate and have subsequently gone up. The 10 year treasury yield started the quarter with a yield of 3.87% and ended the quarter at 4.21%, an increase of 34 basis points. Predictably, the increase in yields was bad for securities that are sensitive to interest rates during Q1; Real estate sector stocks returned -0.5%, intermediate bonds returned -0.8%, and long term bonds returned -2.4%.
Very often, increasing interest rates drive equities to have negative returns as a result of higher debt servicing costs, higher discount rates, and crowding out because bonds have more attractive yields, however, during Q1 there was such enthusiasm for A.I. stocks that equity prices overcame the headwind of higher interest rates and had a terrific quarter. There were seven days during the quarter when the S&P 500 rose more than 1%, most of which were the direct result of one or more tech companies reporting good earnings. For example, the largest one day return during the quarter was a 2.1% jump in the S&P 500 the day after Nvidia reported Q4 earnings that beat analyst expectations. A couple weeks later, Oracle beat earnings expectations and the market jumped ahead another 1.1% in one day.
Oil prices for WTI crude rose from $71.65 per barrel at the start of the quarter to $83.17 at the end of the quarter, a 16% increase. Energy stock prices rose in parallel, with the S&P 500 Energy Sector Index returning 13.7% during Q1. Reasons cited for the increase include OPEC production cuts and strong demand.
Real estate was the worst S&P 500 sector this quarter. In previous commentaries, we have written about our concerns about the real estate sector, due to high interest rates and the impact on commercial real estate from the work-at-home trend. Studies have reported that there may be an oversupply of apartment buildings that were started a few years ago when interest rates were near zero, which could have a negative impact on occupancy rates.
Looking Forward
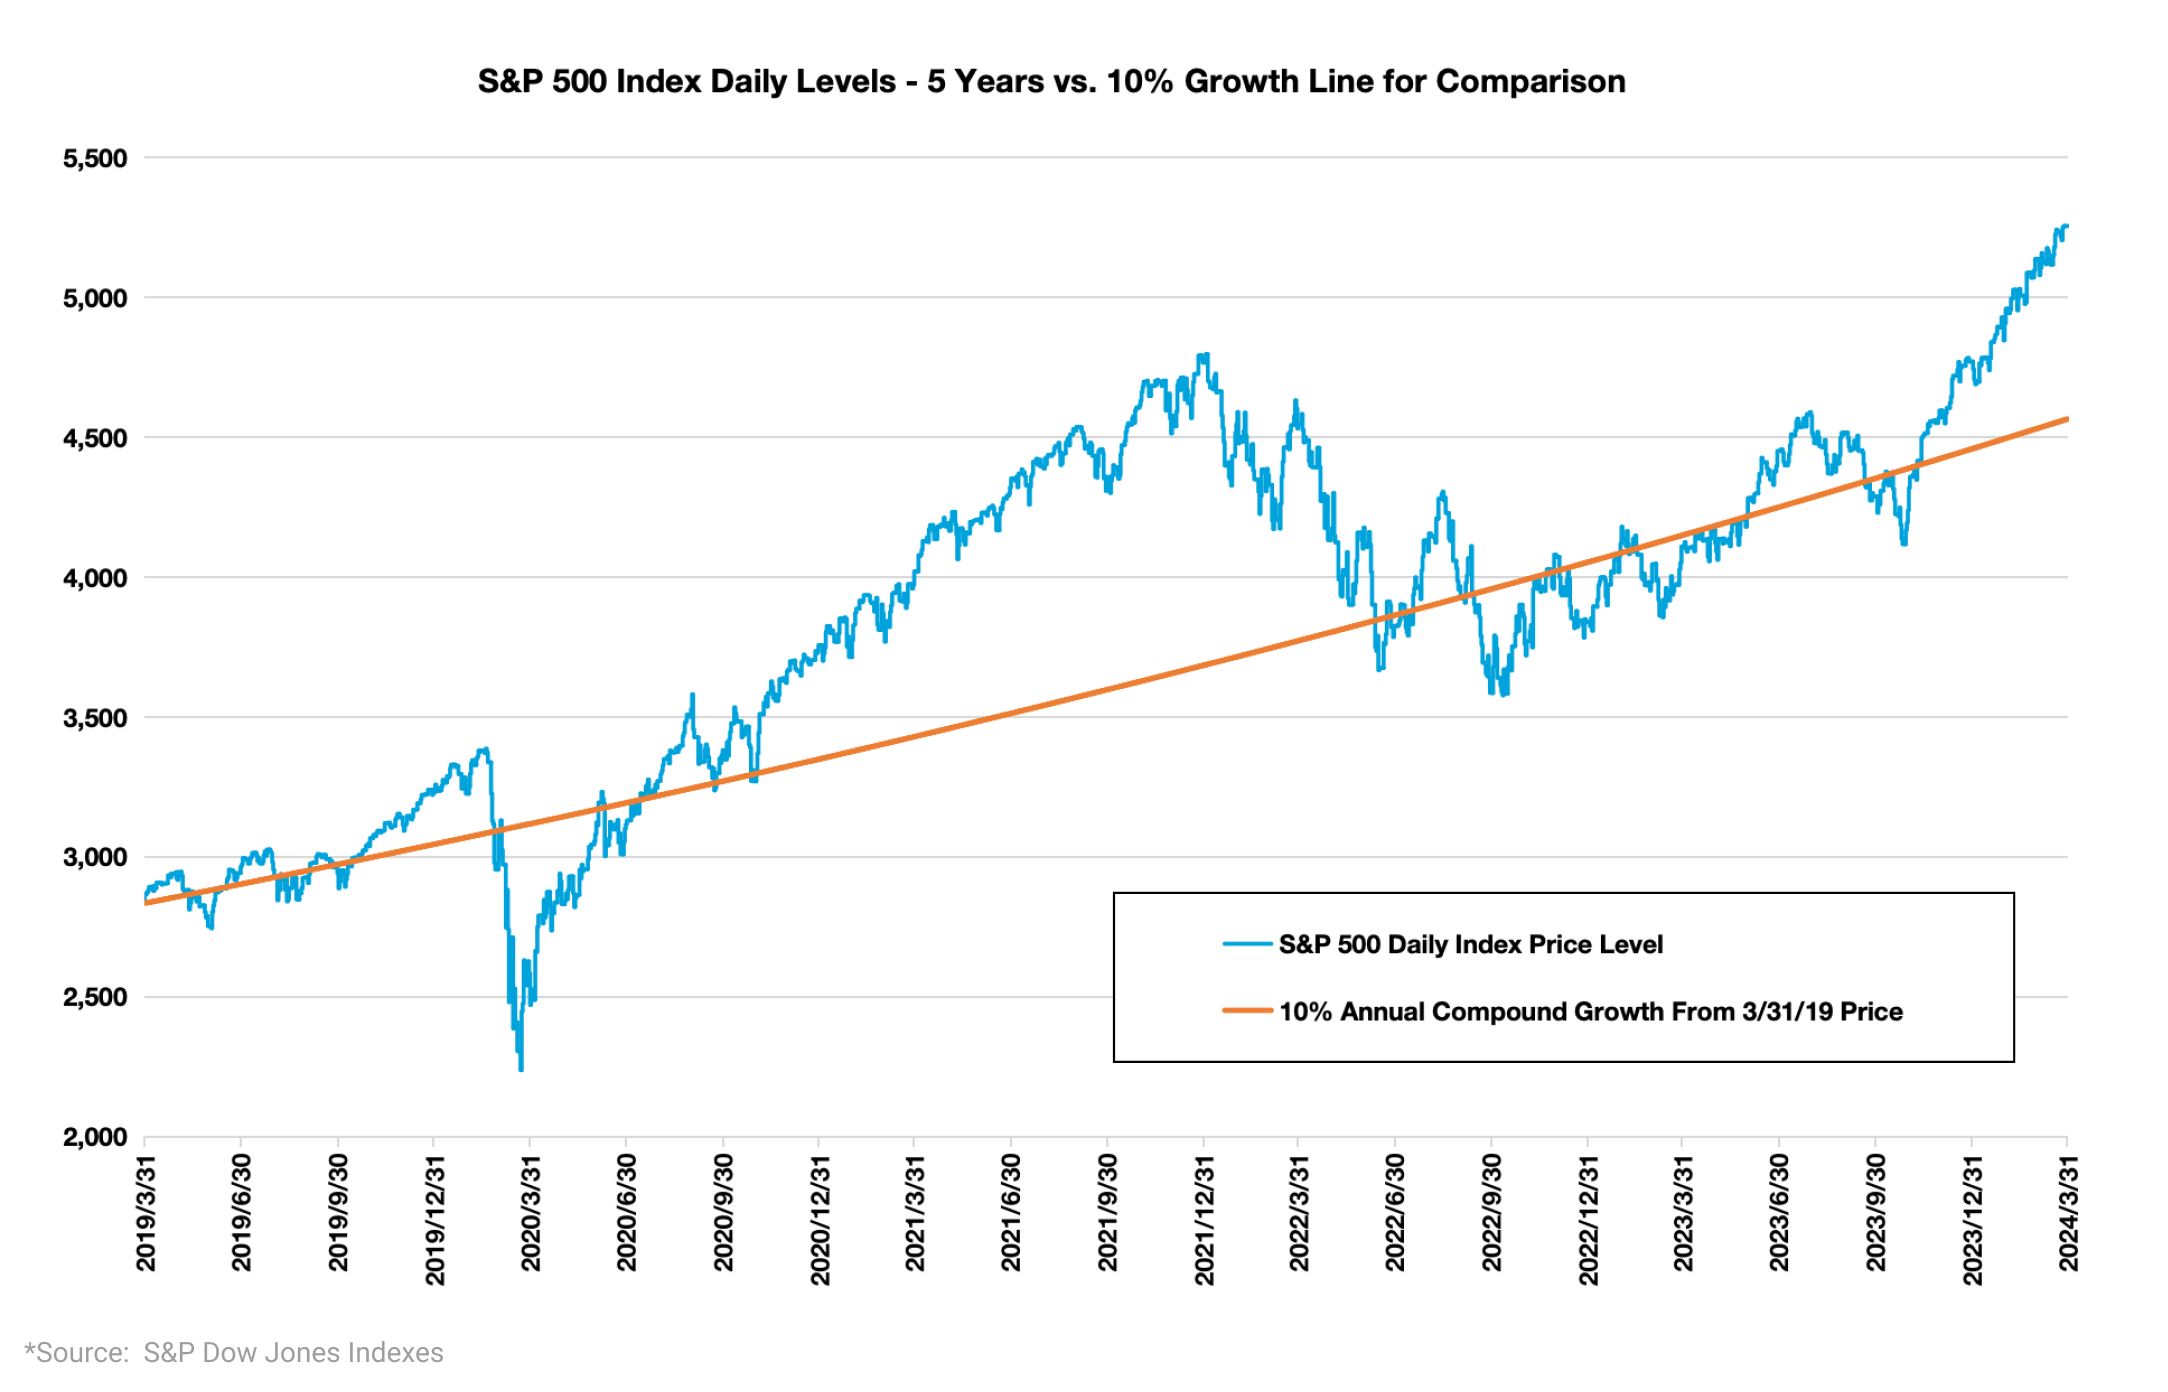
One of the most simple tests I like to start with to evaluate whether the market may be over or undervalued is a comparison of the S&P 500 index to a simple compound price growth line. History teaches us, market cycle after market cycle, that stock prices always revert to fair values over the long run. History is much less helpful in signaling us on when this reversion might happen, but it always happens eventually. Underweighting equities when you believe prices are too high is a very risky move, because you can’t be certain whether you will be able to identify the right day to get back in, before the market pushes up and leaves you with a permanent loss of capital because prices never return back down to your selling level. Overweighting equities when they are undervalued is much less risky because if you are wrong and prices drop, you always know that the market will eventually return up to the level where you bought in.
This comparison to a simple price growth line is very simplistic for many reasons, including; 5 years is not very far back in historical terms, the 10% line is a bit generous as it is about 2% higher than the S&P’s roughly 8% historical price return, the starting point of 3/31/2019 may have been a point at which stocks were overvalued or undervalued, and this analysis ignores changes in the interest rate environment. Even with its simplicity, I find this chart does a great job of helping us understand where we might be in the market cycle. As of today, stocks look a bit overvalued, but not so overvalued that we feel compelled to become defensive. If stock prices gap up much higher though, we will start to look for attractive opportunities to get defensive.
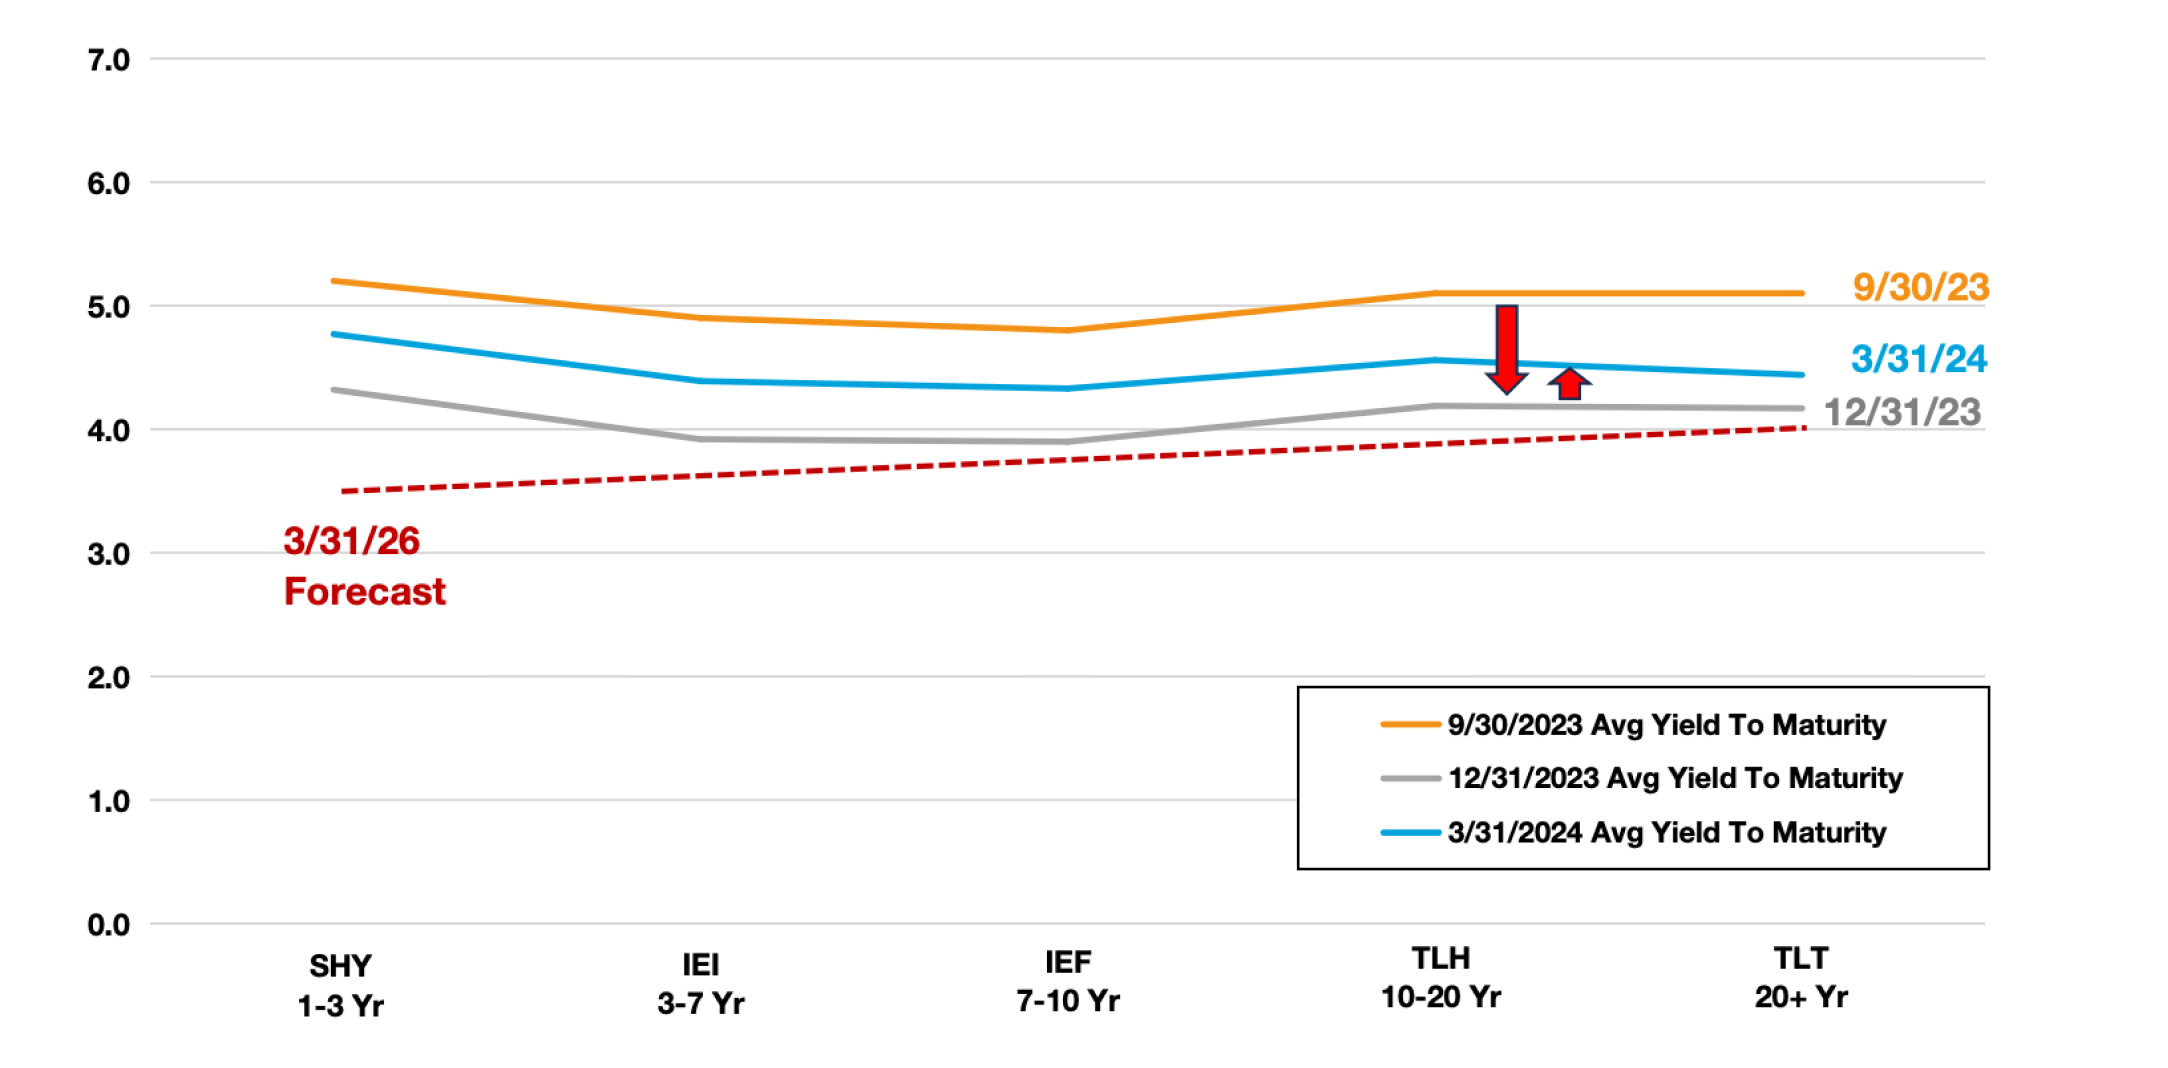
Our Advyzon portfolios have been underweight to long term bonds for many years, which has been a good portfolio tilt and boosted our relative returns. We have been watching for the right time to get back into long term bonds, because in markets when interest rates are not rising, they have proven to be a good source of portfolio return and diversification. In our 9/30/23 market commentary, we included a table with yields to maturity for various iShares ETFs that help us clearly see the differential in potential coupon payments across the yield curve for easy to understand ETFs. We have reproduced that table below with a column for 3/31/2024 yields,

In Q4 of 2023, yields dropped significantly with a parallel shift down, but bounced partially back up during Q1 of 2024. We expect to see more downward adjustment during the next two years.
Important Disclosures
Opinions expressed are as of the current date; such opinions are subject to change without notice. Advyzon Investment Management shall not be responsible for any trading decisions, damages, or other losses resulting from, or related to, the information, data, analyses or opinions or their use. This commentary is for informational purposes only. The information, data, analyses, and opinions presented herein do not constitute investment advice, are provided solely for informational purposes and therefore are not an offer to buy or sell a security. Please note that references to specific securities or other investment options within this piece should not be considered an offer (as defined by the Securities and Exchange Act) to purchase or sell that specific investment or a recommendation for a particular product.
Performance data shown represents past performance. Past performance does not guarantee future results. All investments involve risk, including the loss of principal. There can be no assurance that any financial strategy will be successful. This commentary contains certain forward-looking statements. We may use words such as “expects”, “anticipates”, “believes”, “estimates”, “forecasts”, and similar expressions to identify forward-looking statements. Such forward-looking statements involve known and unknown risks, uncertainties and other factors which may cause the actual results to differ materially and/or substantially from any future results, performance or achievements expressed or implied by those projected in the forward-looking statements for any reason.
Investment management and financial advice offered by Advyzon Investment Management is intended for citizens or legal residents of the United States or its territories. Investing in securities involves risks, including but are not limited to; currency risk, political risk, geographic risk, concentration risk, custody risk, asset class risk, management risk, market risk, operational risk, passive investment risk, securities lending risk, tracking error risk, tax risk, valuation risk, and infectious illness risk. Investing in emerging markets may increase these risks. Emerging markets are countries with relatively young stock and bond markets. Typically, emerging-markets investments have the potential for losses and gains larger than those of developed-market investments. A debt security refers to money borrowed that must be repaid that has a fixed amount, a maturity date(s), and usually a specific rate of interest. Some debt securities are discounted in the original purchase price. Examples of debt securities are treasury bills, bonds and commercial paper. The borrower pays interest for the use of the money and pays the principal amount on a specified date. High yield debt (non-investment grade or junk bonds) can be more risky than higher rated debt, typically has a higher default rate than investment grade and treasury debt, and high yield funds can lose principal.
“SBBI” stands for “Stocks, Bonds. Bills, and Inflation”. “Stocks, Bonds, Bills, and Inflation”, “SBBI”, and “Ibbotson” (when used in conjunction with a series or publication name) are registered trademarks of Morningstar, Inc. ©2021 Morningstar. “CRSP” stands for Center for Research in Security Prices. Part of the University of Chicago’s Booth School of Business, the CRSP is a nonprofit organization that is used by academic, commercial, and government agencies to access information such as price, dividends, and rates of returns on stocks.
The indexes noted are unmanaged and cannot be directly invested in. Individual index performance is provided as a reference only. Since indexes and/or composition levels may change over time, actual return and risk characteristics may be higher or lower than those presented. Although index performance data is gathered from reliable sources, Advyzon Investment Management cannot guarantee its accuracy, completeness or reliability.