

Asset class recap for the quarter
Returns started the quarter strong, but rising interest rates cast a pall over markets, driving a majority of asset classes to post negative returns for the third quarter.

The first four weeks of the quarter were good for stock investors. The S&P 500 index rose 3.1% in July on good news about slowing inflation, but subsequently dropped 6.6% in August and September on less positive inflation indicators, concerns about a government shutdown and debt, and striking unions.
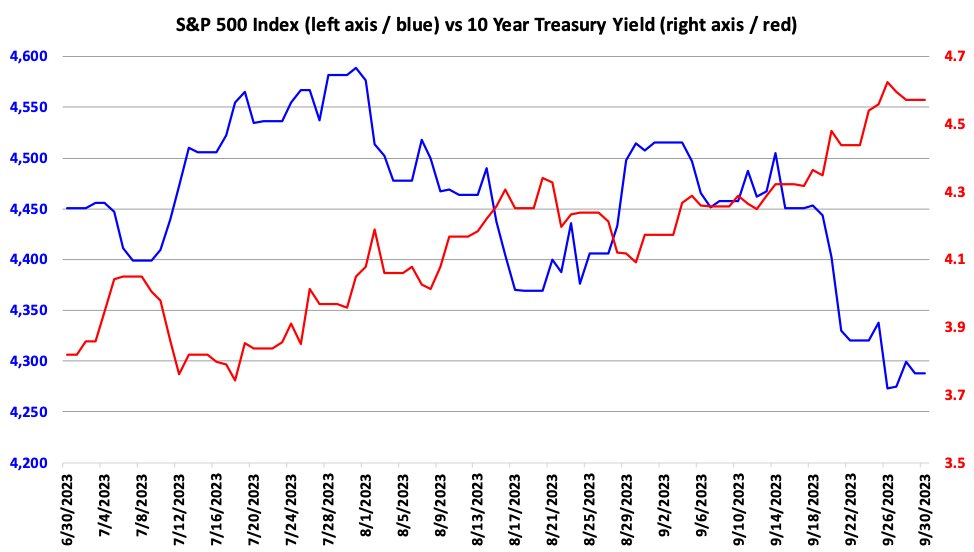
Interest rates have been the dominant driver of market returns across asset classes. The chart below plots the S&P Index price level (in blue) against the yield for the 10 Year Treasury Bond (in red) during Q3. The inverse relationship between the two is crystal clear through this view. When interest rates rise, the S&P 500 index drops and vice versa.
On the whole, stocks have returned a healthy 13.1% so far in 2023, but there is a wide disparity among returns for sectors. The chart below plots the current YTD return for each S&P sector in blue, the highest return reached during 2023 for each sector in green, and the lowest return for the year so far in red. Sectors are sorted from highest YTD return to lowest.
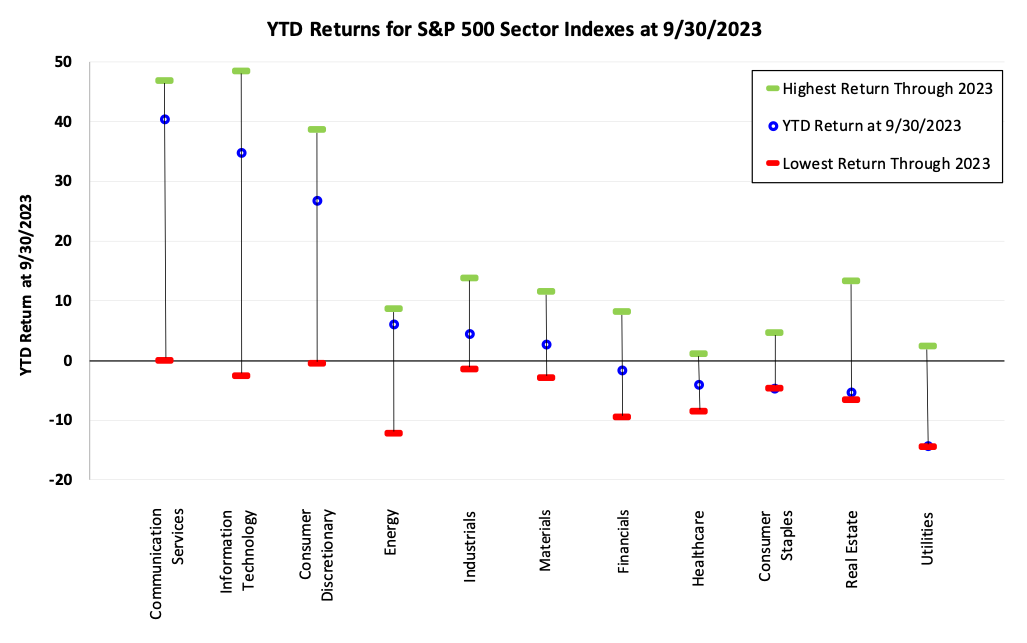
On the left side, we have sectors with outsized returns, above +25%, that have benefited from the recent Artificial Intelligence fervor. On the right we have sectors with negative returns, whose earnings and market valuations are highly sensitive to interest rates. In the middle, we have sectors with typical annual returns in the 5% to 10% range. Predicting whether these trends will reverse or will persist is very difficult – we recommend that the majority of an investor’s portfolio stay allocated across a diverse set of equity sectors.
Long term bond prices were punished severely during the third quarter, as prices went down more than 10%. The yield curve has been inverted (where short term bonds yield more than longer term bonds) for many quarters now. Inverted yield curves are like thunderstorms – they are scary because they often precede economic recessions, but they never last for too long. Economists agree that the yield curve will eventually return to its normal upward slope, but disagree on how. Some believe that the short end will go down within the next year while others believe the longer end will rise. Investors who expect short term rates to drop while long rates stay static are comfortable buying longer term bonds. Investors who expect long term rates to rise should have short durations and avoid owning long term bonds (which is our position at Advyzon Investment Management). During the last five months, the latter has been happening – longer term bond yields have jumped while prices have plummeted.
The table below shows recent returns and resulting Yield To Maturities (YTM) for a series of bond ETFs from iShares. For the past few years, carrying an underweight to longer term bonds was clearly the more optimal way to invest, as we see that TLT, a popular Long Term Bond ETF has lost 42.3% over the last 3 years. A year ago, the YTM for the TLT ETF was 3.3%. With the recent price drop, the current YTM is a much more attractive 5.1%. That level is still below the long term historical average level, but at least yields have caught back up to short term bonds (SHY at 5.2%). We are being cautious and not yet increasing the duration of our portfolios. We suspect that Long Term bond yields are more likely to reach 5.5% before they see 4.5%.

The Magnificent Seven
There have been many headlines recently about the largest seven US corporations, calling attention to their ever-increasing market capitalizations and outsized returns when compared to other US companies. Certainly, if you owned these securities over the last couple years, directly or through a fund, you enjoyed good performance. But all securities that have valuations much higher than the market eventually come back down. Sometimes it happens abruptly and sometimes it takes years. One simple and popular way to evaluate the attractiveness of stocks is by calculating the Price to Earnings (P/E) level and comparing P/Es across investments and to their own histories.
The weighted average earnings for all 500 stocks in the S&P 500 index over the last twelve months (ttm) has been $181.21. When we buy a share of a fund that tracks an index, we are buying the ownership rights to our portion of the earnings of each corporation in the fund. Larger companies contribute a higher dollar amount to the $181.21 in earnings than smaller companies because of their higher weighting in the fund/index. The blue line in chart below plots the cumulative ttm earnings for companies in the S&P 500 index with the scale on the left axis, starting with the largest companies and adding in the smaller companies. The orange line plots the cumulative weight for the same stocks in the index, with the scale on the right axis.
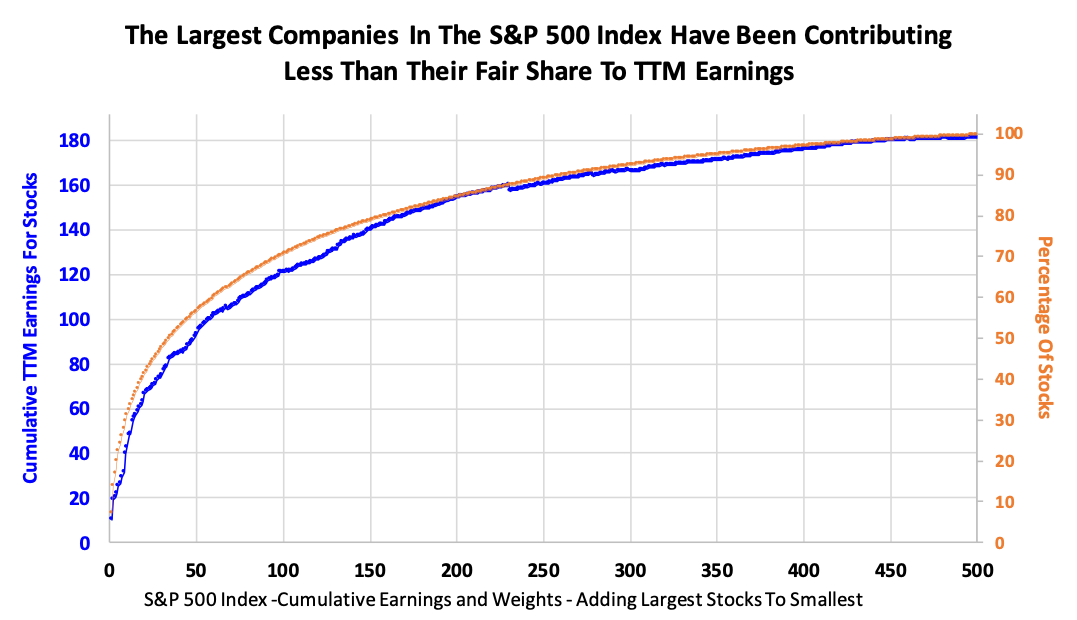
The chart above shows a gap between the earnings (in blue) and the cumulative weight in the S&P 500 index (in orange) that reaches its widest point around the 45th largest company. This suggests that the largest seven companies may be overvalued, but the extent of the overvaluation looks like it also reaches much farther than the top seven, and into “mega cap” in general. The earnings gap suggests that investors have bid up prices for these mega cap companies, not based on the growth of their recent earnings, but based on the expectation that these companies might have future earnings growth that exceeds the earnings growth of less large companies (the smallest corporations in the S&P 500 currently have market capitalizations in the $5 billion range, so we can’t call any of these companies “small”).
Sometimes these outsized earnings growth expectations come to pass, but more often, they do not. This might be an attractive time to move from a purely market cap weighted investment strategy into one that puts a cap on the largest fund constituents, or maybe uses an equal weight strategy. Investors who hold direct stock positions in the largest US corporations (with market capitalizations above $140 billion dollars) might consider trimming their position, unless the tax consequences are too prohibitive. In our Advyzon Investment Management portfolios, we are allocating to an all cap US Equity ETF, but then we augment that allocation with additional allocations to mid and small cap, bringing our overall weighted average market cap exposure down slightly from the average for the general market.
Important Disclosures
Opinions expressed are as of the current date; such opinions are subject to change without notice. Advyzon Investment Management shall not be responsible for any trading decisions, damages, or other losses resulting from, or related to, the information, data, analyses or opinions or their use. This commentary is for informational purposes only. The information, data, analyses, and opinions presented herein do not constitute investment advice, are provided solely for informational purposes and therefore are not an offer to buy or sell a security. Please note that references to specific securities or other investment options within this piece should not be considered an offer (as defined by the Securities and Exchange Act) to purchase or sell that specific investment or a recommendation for a particular product.
Performance data shown represents past performance. Past performance does not guarantee future results. All investments involve risk, including the loss of principal. There can be no assurance that any financial strategy will be successful. This commentary contains certain forward-looking statements. We may use words such as “expects”, “anticipates”, “believes”, “estimates”, “forecasts”, and similar expressions to identify forward-looking statements. Such forward-looking statements involve known and unknown risks, uncertainties and other factors which may cause the actual results to differ materially and/or substantially from any future results, performance or achievements expressed or implied by those projected in the forward-looking statements for any reason.
Investment management and financial advice offered by Advyzon Investment Management is intended for citizens or legal residents of the United States or its territories. Investing in securities involves risks, including but are not limited to; currency risk, political risk, geographic risk, concentration risk, custody risk, asset class risk, management risk, market risk, operational risk, passive investment risk, securities lending risk, tracking error risk, tax risk, valuation risk, and infectious illness risk. Investing in emerging markets may increase these risks. Emerging markets are countries with relatively young stock and bond markets. Typically, emerging-markets investments have the potential for losses and gains larger than those of developed-market investments. A debt security refers to money borrowed that must be repaid that has a fixed amount, a maturity date(s), and usually a specific rate of interest. Some debt securities are discounted in the original purchase price. Examples of debt securities are treasury bills, bonds and commercial paper. The borrower pays interest for the use of the money and pays the principal amount on a specified date. High yield debt (non-investment grade or junk bonds) can be more risky than higher rated debt, typically has a higher default rate than investment grade and treasury debt, and high yield funds can lose principal.
“SBBI” stands for “Stocks, Bonds. Bills, and Inflation”. “Stocks, Bonds, Bills, and Inflation”, “SBBI”, and “Ibbotson” (when used in conjunction with a series or publication name) are registered trademarks of Morningstar, Inc. ©2021 Morningstar.
“CRSP” stands for Center for Research in Security Prices. Part of the University of Chicago’s Booth School of Business, the CRSP is a nonprofit organization that is used by academic, commercial, and government agencies to access information such as price, dividends, and rates of returns on stocks.
The indexes noted are unmanaged and cannot be directly invested in. Individual index performance is provided as a reference only. Since indexes and/or composition levels may change over time, actual return and risk characteristics may be higher or lower than those presented. Although index performance data is gathered from reliable sources, Advyzon Investment Management cannot guarantee its accuracy, completeness or reliability.