

Asset Class Recap
Interest rates continued to climb during the third quarter, leading both equity and fixed income assets to experience a third consecutive quarter of price declines. It is looking more and more like 2022 will be a year of significant losses for both stock and bond markets around the globe - greater than 20% down for stocks and greater than 10% down for bonds.

There is a lot of uncertainty about how much higher interest rates are going to go during the next year and beyond. The Federal Reserve has been keeping interest rates artificially low since the Great Recession started in late 2007 and a whole new generation of investors, home buyers, and consumers are going to have to recalibrate their expectations for rates on home loans, car loans, credit card interest rates, and savings accounts. The new neutral interest rate level will also be important to help predict the fair price level for the stock market. Historically, the price level for the S&P 500 index has averaged around Annual Earnings per Share / (10 Year T-Bond Yield + 1.89%), where 1.89% is a form of equity risk premium demanded by the market above Treasury yields.
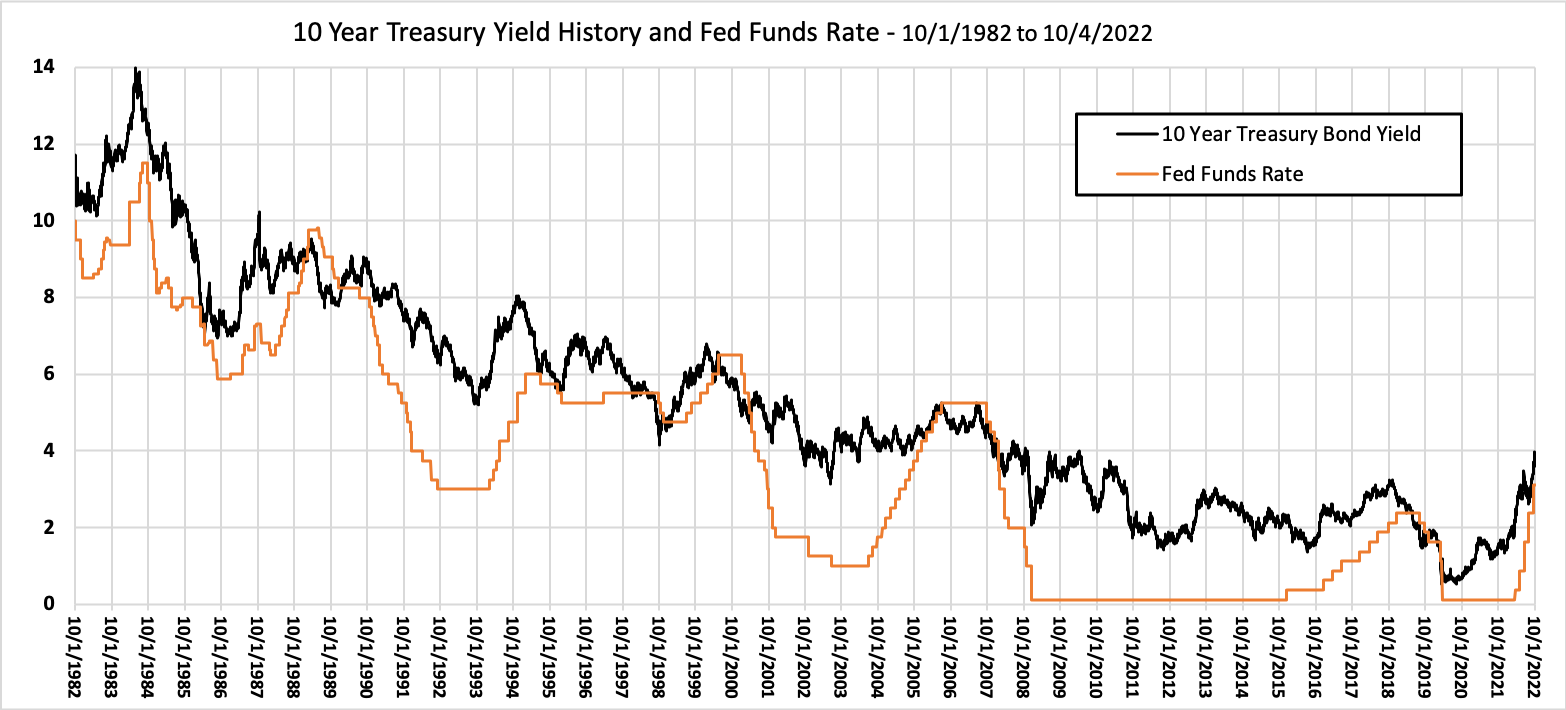
Often history can help us set forward expectations for future market valuation levels. But when we look at a 40 year chart of historical yields for 10 Year U.S. Treasury Bonds (below), we see the very long slide in rates from 15% in the early 80’s to below 1% two years ago, without much “normal” along the way. We might use the few years before the start of the Great Recession started in Q4 2007 as our benchmark for Normal. The 3 ½ years starting 2Q 2004 and ending Q3 2007 followed the tech bubble’s pop and preceded the Fed’s reaction to the Great Recession and might be considered the most recent period during which supply and demand in the market were free to naturally set rates. The average yield for 10 Year Treasury Bonds during this period was 4.55%. This is meaningfully higher than 3.80%, where yields ended at September 30, so I expect rates to continue to climb and I expect analysts who do not use a long term lens to continue to be surprised at the pace of rate increases.
If we insert an expected yield of 4.55% into the stock price formula above with an earnings value of $220 per share, we find a potential S&P 500 index price level target of $3,416 = ($220 / (.0455 + .0189)) for the end of the year. The S&P 500 index ended September at $3,585 per share, so we are pretty close, but still a little high - unless rates do not actually rise that high or earnings end up surprising to the upside in the next couple quarters.
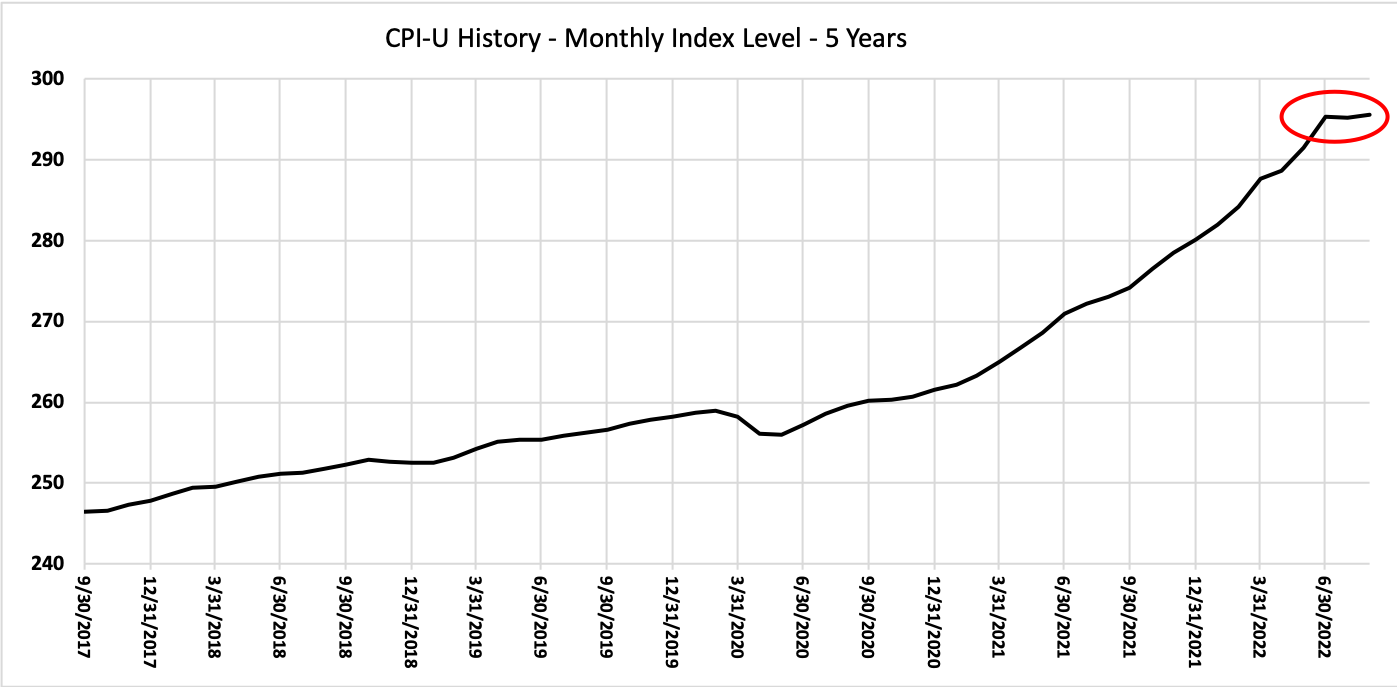
Inflation has very recently shown signs of tapering off. Each month the Bureau of Labor Statistics publishes their Consumer Price Index values and their July and August readings are not much higher than the June readings. Two readings are not any sort of guarantee that inflation is now under control, but these flat readings are a terrific start. If the Fed does not have to worry about runaway inflation, the chance of seeing rates above 5% is very slim.
Before this year, there were six calendar years with losses over 20% for the S&P 500 index since 1926. The one year following each of these drawdowns has averaged an above average +12.0% total return (and much higher if we were to exclude the Great Recession in the 1930’s) and is a good reason for investors to not panic and exit the market at a low point.

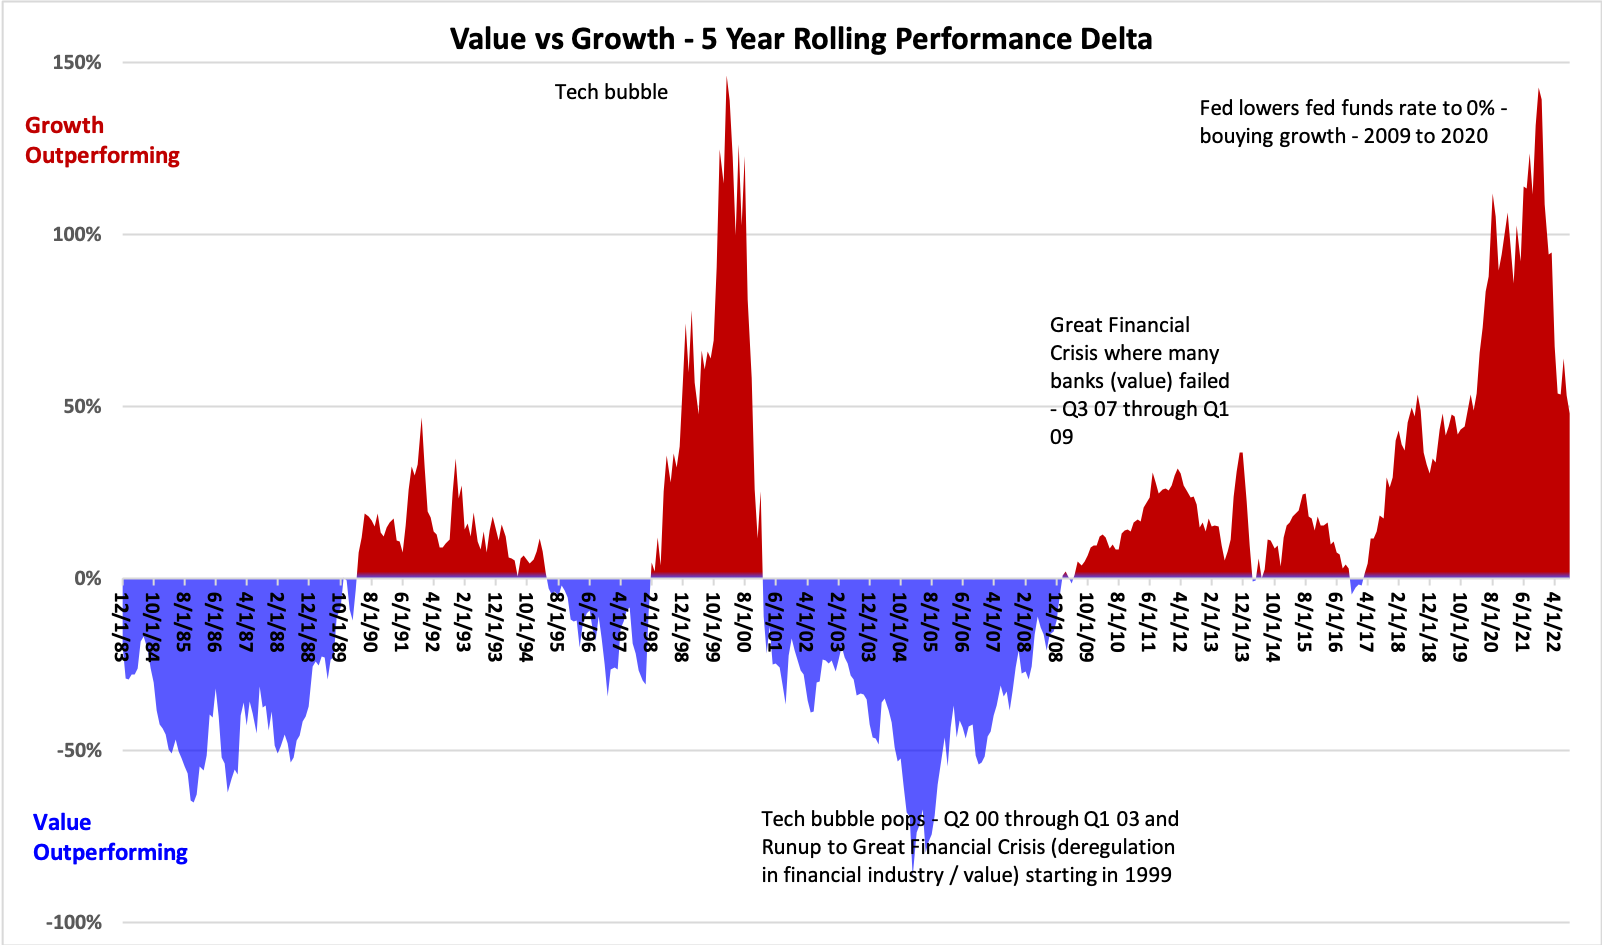
Value has been outperforming Growth during 2022, after 15.3 years of outperformance by Growth. While Value has made a comeback relative to Growth, valuations for many Value oriented investments continue to look more attractive than Growth investments and we are holding onto our slight Value overweight in our portfolios.
Non-US Equities have performed worse than US stocks after currency impacts are taken into account. It is interesting to decompose returns for non-US mutual funds and ETF’s into the local price change and the currency impact. For the year, prices are down only 14.1% year-to-date for the MSCI EAFE local currency index, while the S&P 500 is down 23.9%. This would be great news for investors who diversify into international stocks, however, the currency impact of -13.0% erased all of the diversification benefit and the total return for MSCI EAFE US Dollar index has been -27.1% so far in 2022. Technical analysis has identified interest rate differentials across countries as a major driver of currency changes. The US has increased interest rates much more quickly than many other countries, making our bonds and our currency much more attractive than countries that still have very low interest rates. It was remarkable but understandable that the Euro’s value dropped below $1 in August as a result. Many economists expect non-US currencies to continue to lose value relative to the US Dollar until other countries increase rates. For this reason, we are a bit apprehensive about investing in non-Dollar denominated securities for now.
While stocks have historically shown a tendency to exhibit price rebounds following price drops, bonds are much less likely to experience the same sort of price rebound. Bonds with fixed coupon payments have prices that react to changes in prevailing yield. Because the yield increases we have seen during 2022 are very unlikely to reverse themselves, we are unlikely to see prices “pop” back up to give us double digit positive bond returns next year. However, the good news is that long run bond returns are primarily made up of their yield and future yields are very likely to stay higher than the yields from the last 15 years. This makes longer term bonds much more attractive today than they were over the last few years. We have a duration underweight in our portfolios, but will likely remove it soon.

Disclosures
Opinions expressed are as of the current date; such opinions are subject to change without notice. Advyzon Investment Management shall not be responsible for any trading decisions, damages, or other losses resulting from, or related to, the information, data, analyses or opinions or their use. This commentary is for informational purposes only. The information, data, analyses, and opinions presented herein do not constitute investment advice, are provided solely for informational purposes and therefore are not an offer to buy or sell a security. Please note that references to specific securities or other investment options within this piece should not be considered an offer (as defined by the Securities and Exchange Act) to purchase or sell that specific investment or a recommendation for a particular product.
Performance data shown represents past performance. Past performance does not guarantee future results. All investments involve risk, including the loss of principal. There can be no assurance that any financial strategy will be successful. This commentary contains certain forward-looking statements. We may use words such as “expects”, “anticipates”, “believes”, “estimates”, “forecasts”, and similar expressions to identify forward-looking statements. Such forward-looking statements involve known and unknown risks, uncertainties and other factors which may cause the actual results to differ materially and/or substantially from any future results, performance or achievements expressed or implied by those projected in the forward-looking statements for any reason.
Investment management and financial advice offered by Advyzon Investment Management is intended for citizens or legal residents of the United States or its territories. Investing in securities involves risks, including but are not limited to; currency risk, political risk, geographic risk, concentration risk, custody risk, asset class risk, management risk, market risk, operational risk, passive investment risk, securities lending risk, tracking error risk, tax risk, valuation risk, and infectious illness risk. Investing in emerging markets may increase these risks. Emerging markets are countries with relatively young stock and bond markets. Typically, emerging-markets investments have the potential for losses and gains larger than those of developed-market investments. A debt security refers to money borrowed that must be repaid that has a fixed amount, a maturity date(s), and usually a specific rate of interest. Some debt securities are discounted in the original purchase price. Examples of debt securities are treasury bills, bonds and commercial paper. The borrower pays interest for the use of the money and pays the principal amount on a specified date. High yield debt (non-investment grade or junk bonds) can be more risky than higher rated debt, typically has a higher default rate than investment grade and treasury debt, and high yield funds can lose principal.
“SBBI” stands for “Stocks, Bonds. Bills, and Inflation”. “Stocks, Bonds, Bills, and Inflation”, “SBBI”, and “Ibbotson” (when used in conjunction with a series or publication name) are registered trademarks of Morningstar, Inc. ©2021 Morningstar.
“CRSP” stands for Center for Research in Security Prices. Part of the University of Chicago’s Booth School of Business, the CRSP is a nonprofit organization that is used by academic, commercial, and government agencies to access information such as price, dividends, and rates of returns on stocks.
The indexes noted are unmanaged and cannot be directly invested in. Individual index performance is provided as a reference only. Since indexes and/or composition levels may change over time, actual return and risk characteristics may be higher or lower than those presented. Although index performance data is gathered from reliable sources, Advyzon Investment Management cannot guarantee its accuracy, completeness or reliability.
Cryptocurrencies, including Bitcoin, are currently unregulated, illiquid, uninsured, carry technological risks, require unique tax treatment, and are volatile.