

Asset Class Performance Recap as of 9/30/2021
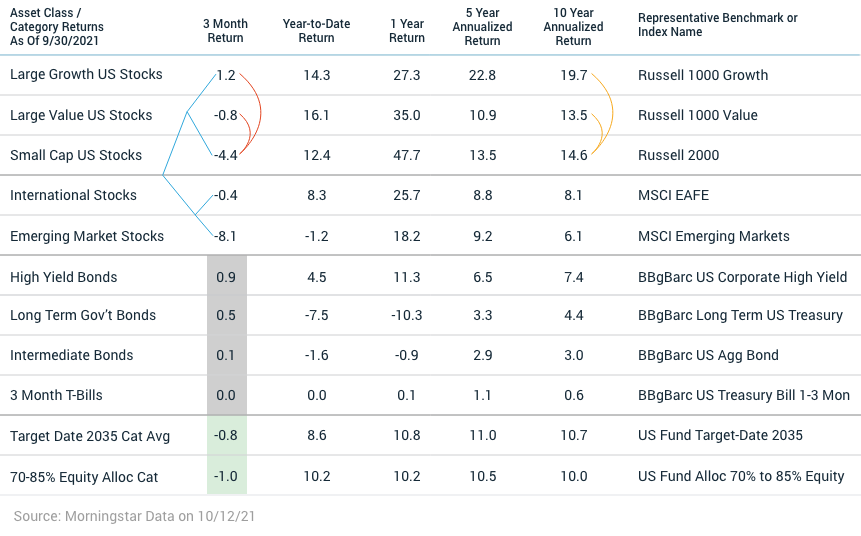
The third quarter produced a mix of performance results with all asset classes coming in below long run expectations. Overall, most diversified portfolios experienced a slight decline in value for the quarter as a whole (see the numbers in the green circle above as examples). There were significant differences in performance among stock returns for investments by company size, geography, and by month.
• By size, larger companies strongly outperformed smaller companies this quarter (see the red lines above). When we compare rolling historical returns between large companies and small companies, we observe multi-year trends where one will dominate for 5 to 10 years, and then leadership tends to switch back. Large companies have been enjoying their time in the sun for the last ten years (see the orange lines above). This article is a year old, but does a good job of reviewing these performance trends https://www.cmegroup.com/education/featured-reports/why-large-cap-stocks-have-outperformed-small-caps.html# Our portfolios have much higher allocations to large companies than small companies, so the recent trend has helped our performance. I suspect that proposed tax law changes may add a drag to corporate earnings in upcoming years and won’t be surprised if we see a switch in performance leadership. Smaller companies tend to have less earnings to be taxed because many are early in their lives and are in growth mode, and should be relatively less impacted by higher tax rates.
• US stocks outperformed non-US stocks during the quarter (compare the values next to the blue lines above). A strengthening US Dollar strength was part of the problem for companies priced in non-USD currencies (e.g. the Euro went from $1.19 at 6/30 to $1.16 at 9/30). Concerns about a real estate bubble in China also helped push prices down for most emerging market focused funds.
• July and August were good months for stocks (the S&P 500 index went up 2.4% in July and 3.0% in August) but September was a down month with a return of -4.7%. News that impacted stock returns negatively included; rising interest rates, the real estate bubble in China, debt ceiling issues in the US, and a slowdown in multiple economic indicators. September has historically been the worst month for stocks. If you are interested in reading about it, this article discusses the September Effect https://www.investopedia.com/ask/answers/06/septworstmonth.asp
Bond returns were unremarkable this quarter (in the gray box above). Returns were a bit below their long run averages, which we expect in the prevailing low interest rate environment. The low but positive returns for bonds provided the portfolio ballast we expect in our diversified portfolios when stock markets get choppy.
Bond returns were unremarkable this quarter (in the gray box above). Returns were a bit below their long run averages, which we expect in the prevailing low interest rate environment. The low but positive returns for bonds provided the portfolio ballast we expect in our diversified portfolios when stock markets get choppy.
A Review Of Historical Stock Market Drawdowns
September’s S&P 500 index return of -4.7% was the worst monthly return since March 2020, when investors were panicked about how bad things could get due to the Coronavirus outbreak and the S&P 500 index returned -12.4%. A couple clients asked me if they should start to be concerned with a 4.7% drop in account values. I enjoy studying historical market events to help understand market relationships, valuations, and how prices react to various news, so I took some time to rebuild a table I have used in the past that reviews negative return periods for stocks. This table can help put a -4.7% monthly return into perspective.
The table below uses monthly returns for the S&P 500 index from Jan 1970 to Sept 2021 and adds the extended Ibbotson® SBBI® US Large-Cap Stock data from Jan 1926 through Dec 1969 to analyze a total of 95.75 years of stock market performance history.
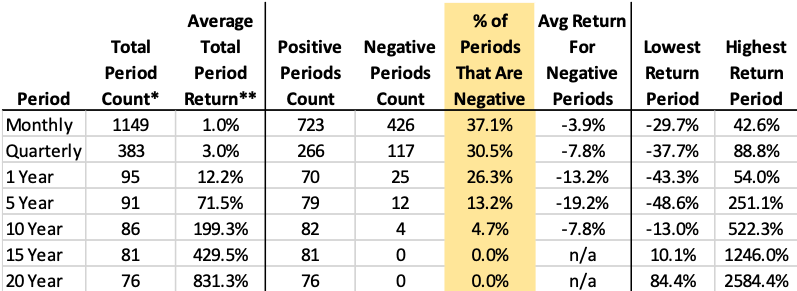
*Includes overlapping data for periods when combining multiple years
** The average shown is a mathematical average of each period’s geometric return
A few observations -
• As you look down the yellow column that shows the percentage of times the market has a negative return, we see that the longer your time horizon, the less likely you are to experience a negative result. Once we get out to 15 years, we see that the market has not yet had a 15 year period over which investors lost money. When viewed through this lens, we can say that longer investment time periods result in lower risk, which provides a great rationale for younger investors to invest more heavily (predominantly) in stocks.
• Many people review their account market values annually. For those people, it is instructive to observe that 26.3% of all 1 year calendar returns are negative. I note on many client calls during conversations about risk, that “The stock market has historically produced negative returns in roughly 1 of every 4 years.” For every one of these negative years, postmortem reviews have identified unfortunate economic, political, and/or natural disaster surprises that caused the price drops that were not expected before the year started. The benefit of suffering through negative returns 26.3% of the time is that the positive years have historically eventually more than made up for the drawdowns and have resulted in an average 12.2% total return for all years, including the negatives.
• In the 10 year row, we see that there have been four “lost decades”, where investors lost money over the entire 10 year period. The years were 1929-1938 and 1930-1939, which were impacted by the Great Depression, and 1999-2008 and 2000-2009, which suffered the double whammy of the Tech Bubble popping and the Great Recession. The optimist in me wants to hope that we learned valuable lessons during these extreme periods and we will experience less lost decades. But the pessimist in me is certain that new market bubbles and subsequent bad news will pop up each generation or two that could result in at least one additional Lost Decade before we hit 2100. Thankfully, history suggests that long term investors who don’t take their money out will recover from them.
• If we use a monthly observation period, we see that negative results have happened 37.1% of the time and the average return for negative monthly periods has been -3.9%. Since last month’s -4.7% return followed seven consecutive positive months, we were actually a bit overdue for a negative monthly result. The severity of the pullback was a bit above average, but was well within the range of normal.
Maintaining a long term mindset for your investments is important and can make a difference in your investing mental health. Diversified investments have always historically bounced back from drawdowns and one of the worst things an investor can do is take their money out of the market after a pullback, because they may miss the subsequent rebound and lock in losses. (Note that the same cannot be said when investing in individual stocks. Individual companies occasionally go bankrupt and can result in a permanent loss of capital). Staying invested through the full investment cycle is a bit like living through the annual weather cycle in the Midwest. Three of the four seasons are very pleasant, but you expect that one out of every four seasons (winter) is going to be painful and unpleasant. Occasionally you get a mild winter and only have to shovel snow two or three times, but sometimes you get a 2011 Chicago Snowmageddon. But you know that the snow will eventually melt and the sun will come back out.
Disclosures
Opinions expressed are as of the current date; such opinions are subject to change without notice. Advyzon Investment Management shall not be responsible for any trading decisions, damages, or other losses resulting from, or related to, the information, data, analyses or opinions or their use. This commentary is for informational purposes only. The information, data, analyses, and opinions presented herein do not constitute investment advice, are provided solely for informational purposes and therefore are not an offer to buy or sell a security. Please note that references to specific securities or other investment options within this piece should not be considered an offer (as defined by the Securities and Exchange Act) to purchase or sell that specific investment.
Performance data shown represents past performance. Past performance does not guarantee future results. All investments involve risk, including the loss of principal. There can be no assurance that any financial strategy will be successful. This commentary contains certain forward-looking statements. We may use words such as “expects”, “anticipates”, “believes”, “estimates”, “forecasts”, and similar expressions to identify forward-looking statements. Such forward-looking statements involve known and unknown risks, uncertainties and other factors which may cause the actual results to differ materially and/or substantially from any future results, performance or achievements expressed or implied by those projected in the forward-looking statements for any reason.
Investment management and financial advice offered by Advyzon Investment Management is intended for citizens or legal residents of the United States or its territories. Investing in securities involves risks, including but are not limited to; currency risk, political risk, geographic risk, concentration risk, custody risk, asset class risk, management risk, market risk, operational risk, passive investment risk, securities lending risk, tracking error risk, tax risk, valuation risk, and infectious illness risk. Investing in emerging markets may increase these risks. Emerging markets are countries with relatively young stock and bond markets. Typically, emerging-markets investments have the potential for losses and gains larger than those of developed-market investments. A debt security refers to money borrowed that must be repaid that has a fixed amount, a maturity date(s), and usually a specific rate of interest. Some debt securities are discounted in the original purchase price. Examples of debt securities are treasury bills, bonds and commercial paper. The borrower pays interest for the use of the money and pays the principal amount on a specified date. High yield debt (non-investment grade or junk bonds) can be more risky than higher rated debt, typically has a higher default rate than investment grade and treasury debt, and high yield funds can lose principal.
“SBBI” stands for “Stocks, Bonds. Bills, and Inflation”. “Stocks, Bonds, Bills, and Inflation”, “SBBI”, and “Ibbotson” (when used in conjunction with a series or publication name) are registered trademarks of Morningstar, Inc. ©2021 Morningstar.
The indexes noted are unmanaged and cannot be directly invested in. Individual index performance is provided as a reference only. Since indexes and/or composition levels may change over time, actual return and risk characteristics may be higher or lower than those presented. Although index performance data is gathered from reliable sources, Advyzon Investment Management cannot guarantee its accuracy, completeness or reliability.
Cryptocurrencies, including Bitcoin, are currently unregulated, illiquid, uninsured, carry technological risks, require unique tax treatment, and are volatile.